
Calculating Your Future Portfolio Withdrawal Amount
Now that you’ve calculated Portfolio Withdrawal Amount in today’s dollars in Part 3, the next step is to project that number into the future. This is where inflation, taxes, and account types all come together.
And this is also the step where most DIY planners freeze up — because the math starts to feel intimidating.
Don’t worry. I’m going to walk you through it clearly, and the calculator below will do the heavy lifting.
Why We Need to Project Forward
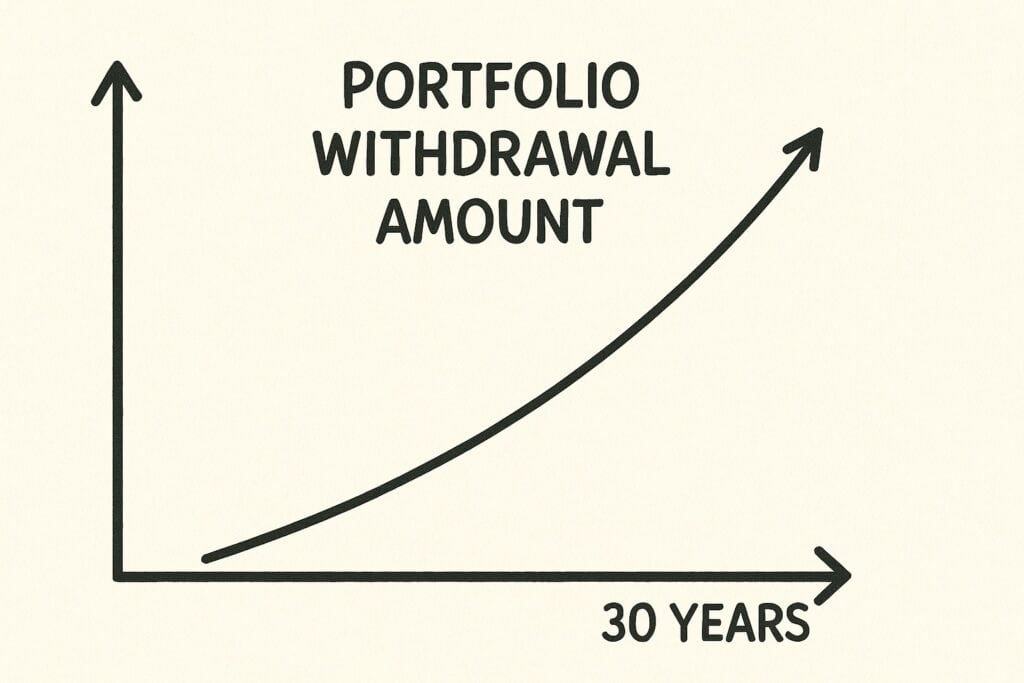
Your Portfolio Withdrawal Amount will grow with inflation — whether you like it or not.
There’s a lot of debate about what inflation number to use. Inflation is volatile. During the COVID spike, U.S. inflation peaked at about 9% (June 2022). As of the most recent Federal Reserve meeting, inflation sits around 3%, which is close to long-term trend levels.
To understand why this matters, think about this:
- A gallon of milk in 1969 cost about $0.47.
- Today, it averages about $4.13.
That’s inflation. It quietly eats away at your purchasing power year after year. This is why most planners — including me — use at least 3% as a planning assumption.
Use the Calculator Below to Project Your Future Portfolio Withdrawal Amount
This calculator estimates what your Portfolio Withdrawal Amount will grow to by the time you retire.
How to Use It (Do These 3 Steps):
1. Enter your Portfolio Withdrawal Amount.
Use the number you calculated in Part 3: What Will Retirement Really Cost You?
Example: $50,000.
2. Choose your assumed inflation rate.
I personally use 3%, but feel free to test different rates and see how much it changes.
3. Slide to the number of years until you retire.
If you don’t know exactly when you’ll retire, use the age at which you’re eligible for full Social Security benefits (you retrieved this in Part 3).
If you skipped that step, go back and do it now — it matters.
Once you enter those three inputs, the calculator will show your:
👉 Future Portfolio Withdrawal Amount
This is the inflation-adjusted number you’ll actually need in retirement.
“This analysis tool was created to illustrate how much money an individual may need to spend in retirement. Any future retirement spending goal generated by this tool cannot be guaranteed to be successful. The tool does not take into account returns, taxes, or other expenses that could affect the result. This tool uses simple math to calculate the result and does not contain any market projections.”
Understanding Where That Income Will Come From
Retirement income comes from three primary “pools,” and each is taxed differently.
1. Taxable Accounts
Examples: brokerage accounts and bank accounts.
You pay taxes in the year you earn:
- Interest
- Dividends
- Capital gains
Key point: 👉 You aren’t taxed for withdrawing, only for the items listed above.
2. Qualified Retirement Accounts (Traditional Money)
Examples:
- 401(k)
- 403(b)
- SIMPLE
- SEP
- Traditional IRA
You get a tax deduction today, but withdrawals in retirement are taxed as ordinary income.
We don’t know your future tax rate — but we can estimate it.
3. Roth Accounts (Tax-Free Money)
Examples: Roth IRA, Roth 401(k)
- No deduction today
- Tax-free growth
- Tax-free withdrawals
These are extremely valuable retirement dollars because they don’t count toward taxable income later.
Example: Estimating Taxes in Retirement (Maine Resident)
Let’s assume you live in Maine.
2025 tax rates for joint filers:
- Federal: 22% for income between $94,301 and $201,050
- State: 6.75% for income between $52,100 and $123,249
(Use 7.15% if you expect higher income)
Convert to decimals:
- Federal: 22% → 0.22
- Maine: 6.75% → 0.0675
Add them:
0.22 + 0.0675 = 0.2875
Subtract from 1:
1 – 0.2875 = 0.7125
This is your after-tax multiplier so if $1.00 leaves your IRA, you keep $0.7125 after taxes.
Now Apply This to Your Portfolio Withdrawal Amount
Let’s say your after-tax Portfolio Withdrawal Amount is $50,000.
If that money is coming 100% from qualified accounts, divide:
$50,000 ÷ 0.7125 = $70,175
You must withdraw $70,175 to end up with $50,000 in your pocket.
Mixing the Three Income Pools
Let’s assume your annual withdrawals look like this:
- $30,000 from qualified accounts
- $15,000 from taxable
- $5,000 from Roth
We focus on the qualified portion first:
$30,000 ÷ 0.7125 = $42,105
If you have $1,000,000 in qualified accounts (often rolled into IRAs in retirement):
$42,105 ÷ $1,000,000 = 4.21%
That’s within the safe, commonly used withdrawal range of 4.0–4.5%.
Before You Move to Part 4.2
Look at your calculator result — your Future Portfolio Withdrawal Amount.
Now do this:
Example (using a 4.5% withdrawal rate):
Convert 4.5% to decimal: 0.045
Divide your future withdrawal amount by 0.045
This gives you the portfolio value you need by retirement.
Write that number down — that’s your target.
A Quick Reminder About Human Capital → Financial Capital
In the last lesson, we talked about shifting money from the human capital circle to the financial capital circle.
One of the most effective ways to do this is through regular, automatic contributions — especially into employer retirement plans.
And if your employer offers a match?
👉 Skipping it is like refusing free money.
The only major exception: If you have crushing high-interest credit card debt (I’ve been there), you may need to address that first. I’ll cover the math behind that in a dedicated post.